
Pokemon Card Price History
Every card we track keeps a rolling 30-day history of its Near Mint market price — one point per day, taken from the value TCGplayer computes out of completed sales, not asking prices. That series is the line on each card's chart, and it is what the movers and most-traded tables below are built from: 2947 cards across 21 sets, last updated 2026-10-23.
Umbreon ex price history (Prismatic Evolutions)
Umbreon ex is $1205.47 today, with 19 completed Near Mint sales in the last 30 days and a -12.3% move over that window. Open the full Umbreon ex price page for every condition tier and the sale range.
Biggest 30-day price movers
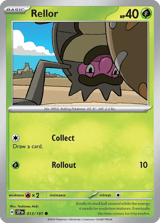
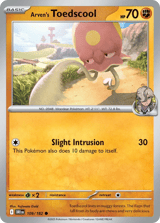
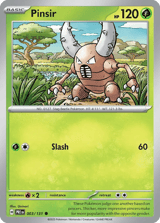
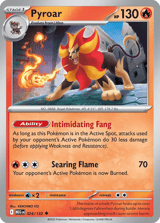
Largest moves in the Near Mint market index over the last 30 days. Only cards with at least 10 completed sales are ranked, so every percentage below is backed by real volume — the sale count is shown beside each move.


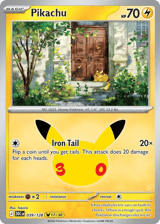

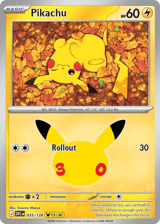

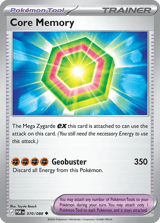
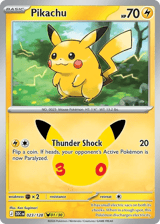
Most-traded cards in the last 30 days
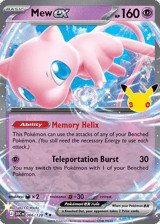
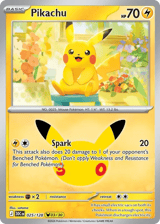
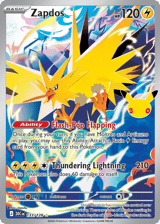
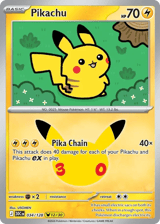
The cards with the most completed Near Mint sales in our book. High sale counts are what make a market index trustworthy — these are the prices with the most transactions behind them.
| Card | Set | 30-day sales | Market price | 30d |
|---|---|---|---|---|
| 30th Celebration | 4479 | $2.77 | -49.5% | |
| 30th Celebration | 4229 | $2.29 | -65.6% | |
| 30th Celebration | 4030 | $5.19 | -57.7% | |
| 30th Celebration | 3996 | $1.05 | -66.3% | |
| 30th Celebration | 3992 | $0.63 | -35.7% | |
| 30th Celebration | 3961 | $5.52 | -55.4% | |
| 30th Celebration | 3936 | $1.03 | -64.8% | |
| 30th Celebration | 3931 | $0.59 | -78.9% |



How to read a card's price history
- The line is an index, not one sale. Each daily point is the Near Mint market price TCGplayer computes from that day's completed sales. An individual copy can sell above or below it depending on condition, print and timing.
- Check the sale count first. A card that changed hands 100 times this month has a stable index; a card with 2 sales can swing on one transaction. Every card page shows how many copies actually sold.
- Condition moves the number more than time. The history here is Near Mint. A Lightly Played or Damaged copy of the same card tracks a lower line — the per-condition prices and discounts are on each card page.
- Short windows mislead. 30 days shows recent direction, not a long-term trend. Read it as "where the market is right now", and re-check before you sell.
Want the current price of every card at once? Open the full Pokemon card price guide, or browse a set: 30th Celebration, Prismatic Evolutions, Ascended Heroes, Gym Challenge, White Flare, Neo Revelation.
Frequently asked questions
How far back does the Pokemon card price history go?
Each card page keeps a rolling 30-day window of daily Near Mint market prices (currently 2026-09-24 to 2026-10-23), taken from the price TCGplayer computes out of completed sales. We also snapshot every card daily on our side, so the series keeps extending the longer a card is tracked.
Is the price history a real sale price or an asking price?
It is a market index built from completed sales, not a listing. Every point is the Near Mint value TCGplayer derives from what copies actually sold for that day — never a seller's asking price. Each card page also shows the real low-to-high sale range and how many copies changed hands, so you can judge how much weight a single day's number deserves.
Why does a card's price jump around some days?
Thinly traded cards move on very few sales, so a single high or low transaction can swing the index. That is why our mover tables only rank cards with at least 10 completed sales in the last 30 days, and show the sale count beside every percentage — a move backed by 100 sales means something different from the same move backed by 3.
Do Pokemon card prices go up over time?
Scarce cards have tended to rise over the long run, but no individual card is guaranteed to. The 30-day history on every card page shows the actual recent direction — risers, fallers and flat — so you can see the trend before you decide to sell or hold, rather than relying on a headline number.